72 AI Search Facts Most Marketers Haven’t Seen Yet
We tested 2,729 businesses across ChatGPT, Claude, Perplexity, Gemini, and Google AI Overviews. These 72 findings challenge the most repeated assumptions about AI visibility—and every one is ready to share.

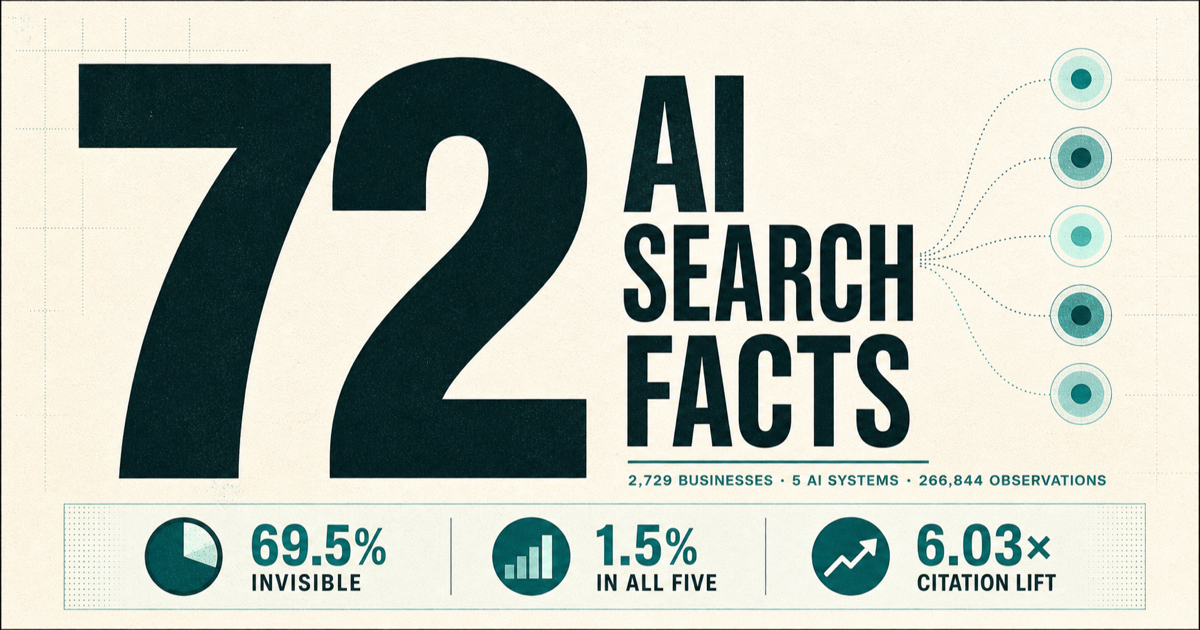
69.5% of 2,729 businesses were invisible across all five AI systems. The larger study also found that off-page signals predicted ChatGPT, Claude, and Perplexity visibility but were mostly null for Gemini and Google AI Overviews. Breadth across credible surfaces—not one platform or authority score—was the most reusable predictor. These are observational findings, not proof of causation.
Nearly seven in ten brands are invisible to AI. Reddit predicts Claude visibility but not Google AI Overviews. Domain Authority stopped being significant once the full signal stack was measured. And when Perplexity cites a brand's URL, that brand is about six times more likely to be named.
Those are four findings from the two-phase Outrigger AI Visibility Index. We tested 2,729 businesses across ChatGPT, Claude, Perplexity, Gemini, and Google AI Overviews, producing 266,844 paired observations. The result is a more useful—and more complicated—picture of AI search than most tactical checklists suggest.
Below are 72 findings distilled for marketers, founders, agencies, and researchers. Each includes the action it suggests and the evidence that keeps the claim honest. Use the share button beside any finding to post that exact takeaway with a direct link back here.
The market reality
Before tactics, start with the size of the visibility gap.
Nearly seven in ten businesses are not ranking poorly in AI. They do not appear at all.
Make the first verified mention the first milestone for an invisible brand.
Phase 2: 69.5% invisible; 95% CI [67.8%, 71.2%]; n=2,729.
Only three in ten businesses earned a mention from even one of the five AI systems tested.
Establish a baseline before investing in GEO; most brands are starting from zero.
Phase 2: 30.5% mentioned by any model; 95% CI [28.8%, 32.2%].
Visibility everywhere is exceptionally rare: only 1.5% appeared in all five models.
Do not confuse one ChatGPT win with market-wide AI visibility.
Phase 2: 1.5%; 95% CI [1.06%, 1.98%].
The invisibility problem grew as the sample grew: 65.9% in Phase 1 became 69.5% in the expanded study.
Use the larger Phase 2 number as the current headline and Phase 1 as the origin story.
Phase 1 n=1,004; Phase 2 n=2,729. The later sample added more small and local businesses.
For most brands, the first AI-search goal is not ‘rank higher.’ It is ‘exist in the answer.’
Report zero-to-one-model movement separately from ranking or prominence gains.
Editorial implication of the 69.5% invisibility rate.
A single-model mention is a wedge, not coverage.
Track visibility separately for ChatGPT, Claude, Perplexity, Gemini, and Google AI Overviews.
Only 1.5% of Phase 2 businesses appeared in all five.
Changing the prompt changed mention rates far less than changing the brand.
Spend less time hunting for one perfect prompt and more time strengthening discoverable signals.
Phase 1 prompt-category mention rates ranged only from 2.8% to 4.3%.
The bigger AI-reputation risk was silence, not criticism.
Solve absence before building a crisis plan for negative AI answers.
Phase 1: 77% of mentions were positive and 0.2% negative; cohort-specific.
One market became five different markets
The most important strategic finding: there is no single AI-search algorithm to optimise for.
The off-page playbook worked on three models and largely failed on two.
Separate ChatGPT, Claude, and Perplexity work from Gemini and Google AIO work.
Of 60 model-by-signal cells, 34 remained significant after FDR correction, concentrated in ChatGPT, Claude, and Perplexity.
Pick the model your buyer uses before you pick the tactic.
Segment prompts and tactics by buyer/model fit instead of selling one generic AI SEO plan.
Phase 2 per-model effects were materially heterogeneous.
Claude was the most off-page-responsive model in the study.
Prioritise earned third-party presence when Claude matters to the buyer journey.
The largest effects were Wikipedia × Claude, Quora × Claude, and Reddit × Claude.
Google AI Overview was the most resistant to the off-page signals we measured.
Treat AIO as a distinct research problem; do not promise a Reddit or directory tactic will move it.
Nearly all tested off-page partial correlations were null for AIO after controls.
Eight of nine common off-page signals were statistically null for Gemini.
Avoid copying a ChatGPT playbook into Gemini without separate evidence.
Only Yelp showed a small significant Gemini effect (+0.070) in the highlighted nine-signal set.
A single composite score can average away the signal you need to act on.
Show both an overall score and the model-by-model breakdown.
The composite hid robust off-page effects in three of five models.
Multi-model monitoring is not a reporting luxury. It is the strategy layer.
Tie every recommended action to the model it is expected to influence.
Direct implication of the model-specific partial-correlation matrix.
The same brand can need two different GEO plans at the same time.
Build an off-page plan for three responsive models and test other mechanisms for Gemini and AIO.
Phase 2 model heterogeneity; mechanisms for Gemini and AIO remain hypotheses.
The model-specific surprises
These are the findings most likely to change where a team spends its next dollar.
Wikipedia presence had the largest single off-page association in the study—and it was with Claude.
Run a Wikipedia eligibility audit for qualifying brands; never manufacture eligibility.
Wikipedia × Claude partial r=+0.219; 95% CI [+0.172, +0.266].
Quora predicted Claude visibility more strongly than Reddit did.
Include credible Quora participation when technical or research-oriented buyers use Claude.
Quora × Claude +0.203 vs Reddit × Claude +0.190.
Reddit mattered most to Claude, not Google.
Use earned Reddit presence for Claude-oriented audiences; do not generalise the result to AIO.
Reddit × Claude +0.190; Reddit × AIO +0.011, not significant.
Reddit still predicted ChatGPT visibility after nine controls.
Treat Reddit as one component of a ChatGPT plan, not the whole plan.
Reddit × ChatGPT partial r=+0.128; 95% CI [0.081, 0.174].
Reddit also predicted Perplexity visibility—but less strongly than it predicted Claude.
Combine community presence with retrieval-eligible pages for Perplexity.
Reddit × Perplexity partial r=+0.110; 95% CI [0.063, 0.156].
A complete LinkedIn company presence was one of Perplexity’s stronger measured off-page signals.
Make the company page complete, consistent, and active before chasing exotic GEO tactics.
LinkedIn × Perplexity partial r=+0.163; FDR-significant.
YouTube presence was associated with visibility in the three off-page-responsive models.
Treat YouTube as an entity and topical-presence asset, not only a video channel.
Perplexity +0.153, Claude +0.182, ChatGPT +0.111; all FDR-significant.
For local brands, BBB and Yelp were inexpensive signals with evidence across multiple models.
Claim, complete, and reconcile these profiles before funding higher-cost experiments.
BBB and Yelp were FDR-significant for ChatGPT, Perplexity, and Claude.
Breadth beats the silver bullet
The web rewards the brands that are corroborated across a network of credible places.
The strongest raw correlate was not Reddit, DA, or reviews. It was the number of places a brand showed up.
Audit the relevant directory and platform set before going deep on one channel.
Directory count r=+0.395; 95% CI [+0.362, +0.427]; n=2,729. Raw correlation.
A broad off-page footprint predicted visibility better than any one fashionable tactic.
Build a balanced footprint across entity, review, community, and media surfaces.
Off-page composite r=+0.389; 95% CI [0.357, 0.420].
YouTube mentions were one of the strongest raw signals in the full sample.
Earn inclusion in third-party videos as well as publishing on the owned channel.
YouTube mention count r=+0.355; 95% CI [0.324, 0.385].
Being present on more review platforms mattered more than obsessing over one perfect profile.
Expand and reconcile the review footprint across category-relevant platforms.
Review-platform count raw r=+0.344; 95% CI [0.307, 0.380].
AI visibility is a system, not a signal.
Sequence several low-friction presence fixes instead of betting the quarter on one channel.
Individual per-model effects were generally +0.10 to +0.22; aggregate breadth was stronger.
Multi-model-visible brands appeared in more than twice as many measured directories as invisible brands.
Use directory breadth as a simple self-audit benchmark.
Phase 2 profile: 6.09 vs 2.67 average directory presences; descriptive, not causal.
YouTube presence separated visible and invisible brands by 41 percentage points.
If the category supports video, an absent channel is an obvious footprint gap.
86.8% of multi-model-visible vs 46.1% of invisible businesses had a channel.
Visible brands did not merely have ‘more authority.’ They had a denser, more legible web footprint.
Measure missing surfaces—Wikipedia, Crunchbase, LinkedIn, reviews, YouTube—not only DA.
Wikipedia: 65.3% vs 26.2%; Crunchbase: 72.6% vs 31.1%.
Content and technical signals
Several popular checklists mattered—but less, or differently, than the industry tends to claim.
More blog content had a real but modest relationship with AI visibility.
Publish fewer, stronger topical assets; do not sell blog volume as the main lever.
Blog-post count r=+0.101; log r=+0.099.
Raw page count looked useless until the extreme outliers were corrected.
Judge site depth on a log scale and by topical usefulness, not raw URL count.
Indexed pages raw r=−0.014; log r=+0.141; Spearman +0.133.
Organic search reach still travelled with AI visibility.
Keep strong SEO foundations; GEO is an added discovery layer, not an SEO replacement.
Log organic clicks r=+0.189; log organic keywords r=+0.168.
Backlink metrics changed sign after skew correction.
Do not quote raw Pearson results for heavily skewed link counts.
External links raw −0.059 → log +0.099; referring domains raw −0.068 → log +0.118.
Citability was small, but it survived the multivariate model.
Make high-intent pages easy to quote with clear claims, definitions, tables, evidence, and attribution.
Citability coefficient +0.123; 95% CI [+0.008, +0.244].
Schema was hygiene, not a differentiator in this dataset.
Implement schema for clarity and eligibility, but do not pitch it as the primary visibility lever.
Schema was the one raw-significant correlation that lost significance after FDR correction.
Blocking AI crawlers did not explain who was already visible.
Treat crawler policy as governance, not a shortcut to visibility.
Full sample r=+0.032, effectively null; historical training and retrieval complicate interpretation.
llms.txt did not hold up as a headline signal in the expanded analysis.
Keep it as a low-cost hygiene item, not the centre of the strategy or budget.
Among 1,547 businesses: llms.txt r=+0.065; llms-full.txt r=+0.018.
Retrieval and citation mechanics
Citation data is powerful, but only when the model and API limitations stay attached.
When Perplexity cited a brand’s URL, the brand was about six times more likely to be mentioned.
Build retrieval-eligible pages and earn inclusion in sources Perplexity already trusts.
6.03× lift; 95% CI [5.62, 6.46]; n=66,920 paired observations. Association, not causation.
Google AIO showed a similar citation-linked lift, but the estimate was much less precise.
Treat the direction as promising and the exact number as uncertain.
6.64×; 95% CI [2.48, 11.30]; n=29,305.
Three of the five tested APIs did not expose source URLs.
Never publish a five-model citation-source chart from these API results.
ChatGPT, Claude, and Gemini returned empty source arrays by construction.
Ninety-seven percent of observed source URLs came from Perplexity.
Label source-category analyses as primarily a Perplexity study.
Approximately 97% Perplexity and 3% Google AIO among exposed citations.
Most ‘AI cites X% from Reddit’ claims are really Perplexity claims wearing an all-AI label.
Ask which model exposed the sources before repeating a citation statistic.
Direct implication of the source-URL ceiling.
Only 6.7% of classified source URLs fell into the study’s directly addressable categories.
Position direct citation placement as a targeted lever, not the whole visibility market.
317 of 4,737 citations; Perplexity and Google AIO only.
For Perplexity, retrieval eligibility is the mechanism worth optimising.
Create clear comparison, category, evidence, and evergreen pages that can enter the source pool.
Editorial implication of the 6.03× citation-linked mention lift.
Being cited and being named travel together—but the study cannot prove which one causes the other.
Use citation-linked lift as prioritisation evidence, not a guaranteed outcome claim.
Within-response observational association; no random assignment.
Vertical and tactical implications
Benchmarks and channel choices get more useful when they reflect the category and buyer journey.
AI invisibility was an industry problem, not a uniform market average.
Benchmark a brand against its own vertical before comparing it with the full sample.
Phase 1: 29% invisible in personal injury law vs 84% in med spa.
SaaS produced both the study’s biggest winners and a large invisible majority.
Category leaders need defence; smaller SaaS brands need a first-mention wedge.
Phase 1: Asana 91 and Zoho 87, while roughly 71–74% of sampled SaaS businesses were invisible.
Local businesses were slightly more visible than national businesses in the first cohort.
Do not assume local equals disadvantaged; dense local authority signals can help.
Phase 1: 37.2% local visible vs 30.0% national.
The best off-page playbook changed by vertical and market.
Build industry-by-market benchmarks instead of issuing universal channel advice.
Phase 2 included 32 industry-market slots with materially different top raw predictors; many were small or noisy.
For local services, verified directory and review profiles are the cheapest evidence-backed first move.
Start with GBP consistency, BBB and Yelp where relevant, and vertical directories.
BBB and Yelp were FDR-significant across the three responsive models; prioritisation inference.
For B2B and SaaS, the useful footprint shifts toward LinkedIn, Crunchbase, YouTube, and category platforms.
Match the platform set to how buyers research the category and which model they use.
LinkedIn and Crunchbase were significant for ChatGPT, Claude, and Perplexity; G2/Capterra mainly for Claude.
A universal Reddit plan is less defensible than a buyer-and-model-specific community plan.
Choose communities based on real buyer attention, then measure the target model separately.
Reddit effects varied sharply by model; Phase 2 is observational.
The fastest useful audit is simple: which models mention you, and on how many trusted surfaces does your brand exist?
Put per-model visibility beside directory and platform breadth on the first screen.
Synthesis of model heterogeneity and off-page breadth.
The caveats worth sharing
Research earns trust when the limits are as easy to find as the headline.
The study found predictors, not proof that a marketing tactic causes visibility.
Use ‘predicts’ and ‘is associated with’ until a controlled trial reports.
Both phases were observational; confounding and reverse causality remain possible.
The major correlation findings were not a multiple-testing accident.
Mention the correction when defending the research, not in every consumer-facing card.
40 of 41 raw-significant correlations remained significant after Benjamini–Hochberg FDR correction.
The strictest model-specific analysis used 1,693 complete cases, not all 2,729 businesses.
Put n=1,693 beside partial-correlation charts and explain the missing-data filter.
Businesses missing any control variable were excluded; the sub-sample is non-random.
Every model response was a one-shot sample.
Treat small changes as noise until repeated measurement establishes reliability.
No test-retest probing; run-to-run variance was not estimated.
Four hundred twenty-six businesses had no resolved first-party URL.
Show the sample size for every URL-dependent analysis instead of defaulting to 2,729.
15.6% URL-resolution gap in Phase 2.
These findings are a timestamp, not a law of nature.
Date every chart and rerun benchmarks as model behaviour changes.
Phase 2 data was collected April–May 2026.
The corrected paper is more valuable because it records what the earlier analysis got wrong.
Make re-analysis part of the story: larger samples should be allowed to change the headline.
v3 demoted DA and replaced the composite off-page headline with the per-model result.
Open data turns a vendor study into an invitation to disagree.
Link the paper, dataset, caveats, and analysis outputs wherever the research is promoted.
Paper DOI 10.5281/zenodo.20076380; dataset DOI 10.5281/zenodo.20076406; CC BY.
The takeaway behind the takeaways
AI visibility is a portfolio problem.
The brands that win are not chasing one hack. They are legible across credible surfaces, measured model by model, and willing to update the playbook when better evidence arrives. Start by learning where you are absent. Then strengthen the footprint your buyer's AI system can actually find.
Method note: Phase 1 and Phase 2 were observational studies. Associations identify useful predictors, not guaranteed causal effects. Phase 2 was collected in April–May 2026, and each model response was sampled once. Model behaviour changes, so every benchmark should be treated as dated evidence.
Frequently Asked Questions
Where do these AI search statistics come from?
They come from Phase 1 and the corrected Phase 2 v3 of the Outrigger Visibility Index. The expanded study tested 2,729 businesses across ChatGPT, Claude, Perplexity, Gemini, and Google AI Overviews, producing 266,844 paired observations. The paper and anonymised dataset are published on Zenodo under CC BY.
Do these findings prove that Reddit, directories, reviews, or citations cause AI visibility?
No. Both completed phases were observational. The results identify associations and useful predictors, but unmeasured confounding and reverse causality remain possible. A separate controlled study is needed to estimate causal impact.
Why are some findings labelled Phase 1 or scoped finding?
Phase 1 findings describe the original 1,004-business cohort and are included where they add useful historical or vertical context. Scoped findings are valid only for a named model, cohort, API limitation, or descriptive comparison. The label prevents a narrow result from being repeated as a universal rule.
Can I share or cite these findings?
Yes. Every fact has a one-click share link back to this article. For formal or research use, cite the open paper at DOI 10.5281/zenodo.20076380 and the dataset at DOI 10.5281/zenodo.20076406. Both are available under CC BY.
Check Your AI Visibility Score
Run a free 5-pillar audit and see where your brand stands across Citations, AI Presence, Entities, Reviews, and Press.
Run Free Audit →Related Articles

The Outrigger Visibility Index: We Tested 1,004 Businesses Across 5 AI Models. 65.9% Are Completely Invisible.
Why Your Brand Doesn\'t Appear in AI Search Results (and How to Fix It)
Share of Model: The AI Marketing Metric Replacing Share of Voice